The ‘Results’ table ![]() includes calculation results in a table.
includes calculation results in a table.

The content of this table depends on the selected elements, the chosen result, the selected load group or combination and the chosen options with ![]() .
.
- The results can be requested for each group and combination of loads, thus, for contoured values of combinations of loads at the level of extreme limit state designs and limit state designs of service. To show results for another combination, open the drop-down menu in the top left corner of the dialogue box.
- The button
 allows you to set certain columns of the table visible/ invisible and allows you to indicate which results you want to see.
- The label of an element and the mesh coordinates can be added to the table as an extra column. The option Mean reaction in line supports results in an extra row in the table.
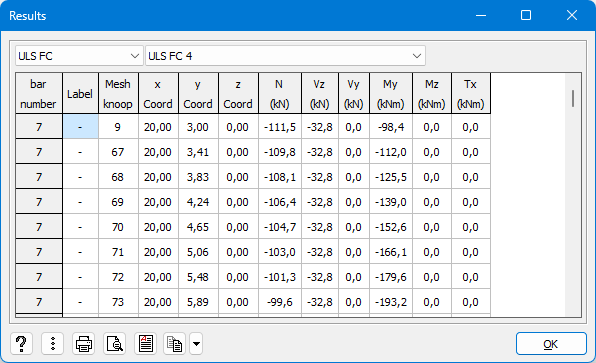
- For bars you can specify which position you want to see the results: extreme values, all mesh nodes, the bar end values or in the common point.
Assume this structure:

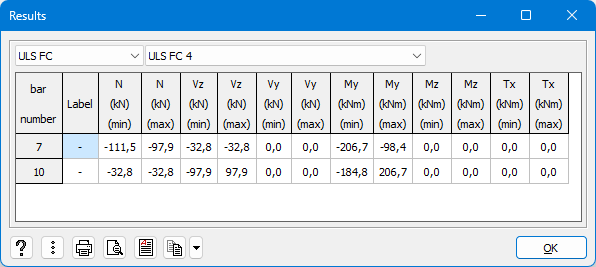
| End values bar | Common point |
| Only the values at the ends of the selected bars are shown in the table. | Only the values in the common point of the selected bars are shown in the table. It is only possible to request this result for bars that only have one point in common. |
 |  |
You can included these results in a calculation report ![]() , print them directly
, print them directly ![]() or convert the data to and RTF
or convert the data to and RTF ![]() . The last two cases, we advise to ask a print preview first using
. The last two cases, we advise to ask a print preview first using ![]() .
.
Use the button ![]() to copy the content of the table. With the pull down list
to copy the content of the table. With the pull down list ![]() you can indicate if you want:
you can indicate if you want:
- to copy only the results for the current combination
- to copy the results for all the combinations
- to copy the results for all combinations within the current set.
If for example you’re looking at the results for ULS FC 4 and you choose this option, all ULS results will be copied.