The way in which the results are presented can be set via the menu ‘Show – Plot settings…’ or by clicking the button ![]() in the toolbar.
in the toolbar.
On the left you will find the icons from the ‘Graphs’ section of the icon palette. You can set individual parameters for each icon:
- Click on the relevant icon.
- Then select the desired representation on the right. Everything you select is only valid for that specific result. However, the parameter for the maximum magnitude of the graph from the bar is valid for all results.
Alternatively, you can adjust the representation for all results in a single step.
- Click on the button ‘Default’.
- Select the desired representation on the right. Everything you select, will be applied to all results.
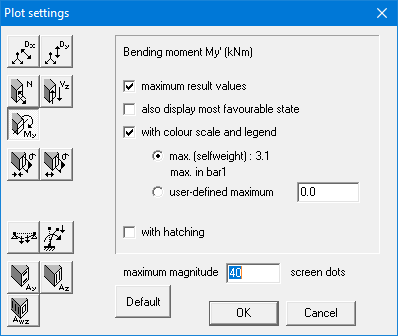
Let’s go over the various representations:
- When you select ‘maximum result values’, the minimum and maximum values are indicated on the graphs.
- In the case of an envelope, you can indicate whether you want to display the minimum graph in addition to the maximum graph with the parameter ‘also display the most favourable state.
- When you choose ‘with colour scale and legend’, the graphs are drawn as a gradient, depending on either the occurring maximum value on the visible elements or a self-specified maximum value. Otherwise, the graphs are presented in the one colour.
- When you choose ‘with hatching’, a projection line between each point (total 11 points per bar), on the bar axis will be drawn, showing the value.