Go to the menu ‘File’ – ‘Print report…’ to print a calculation note. A dialog appears containing 4 tab pages.
Once you have gone through all 4 tabs, you can immediately print the report via the button ![]() , or request a print preview
, or request a print preview ![]() or write an RTF
or write an RTF ![]() .
.
The tab page ‘Page setup’
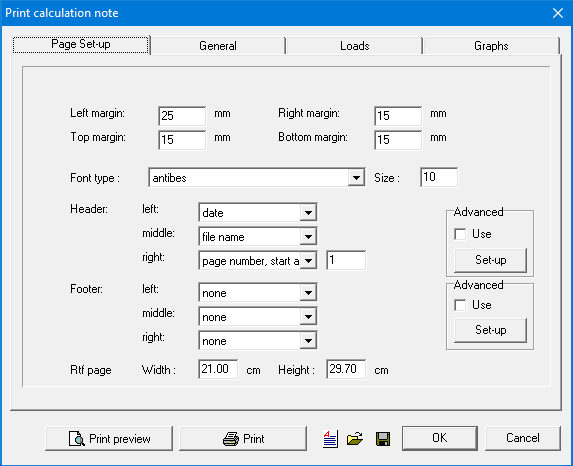
- On top you can define the margins left, right, up and bottom.
- Then you specify how the header and footer should look like. Both are divided in three parts: left, middle and right. For each zone, you have a pulldown list from which you can select the following information:
- None
- The date on which the print took place
- The file name of the project
- Page number
- Random text using the Advanced settings
On the right, check the option ‘Use’ and click on the button “Set-up”. A dialog appears containing three columns corresponding to the three zones previously mentioned.
Click in one of the zones to add information. You can add custom text, optionally spread over multiple lines. If you want to add the print date, click on the button ‘Date’. The same applies for the page numbers and file name. For the page numbers you can indicate at which number he should start. For the file name you can erase the path if necessary.
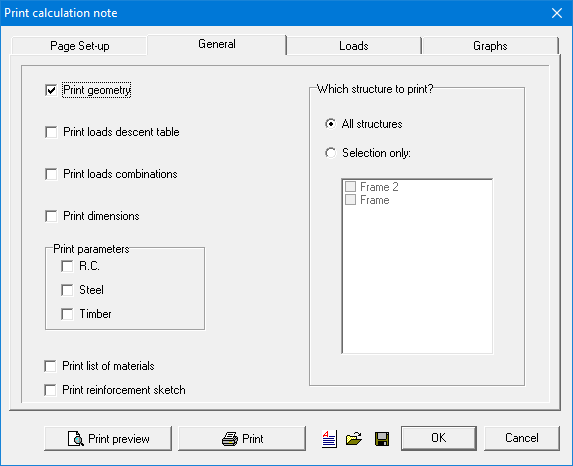
The tab page ‘General’
- Select the option ‘Print geometry’ to add an image of the geometry to the report.
- Then you can indicate which data you want to include in the calculation note:
- a table of the load descent
- an overview of the load combinations
- a sketch of the cross-sections
- the material parameters for steel, reinforced concrete and timber
- a list of materials calculated from the design
- On the right side, you can indicate if you want to print the data for all the structures in the project or only for the selected structures.
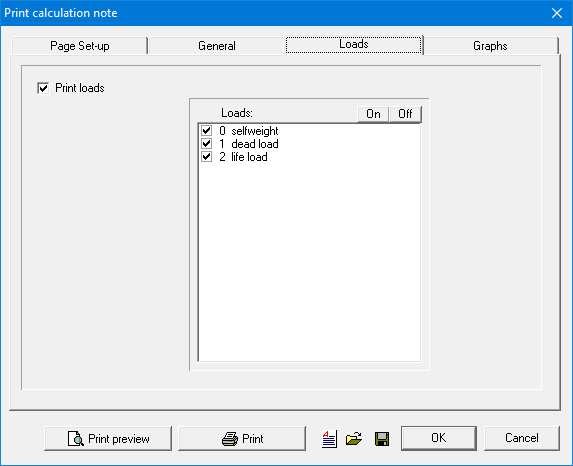
The tab page ‘Loads’
- Select the option ‘Print Loads’ to include an image of the loads in the reports.
- Then select the load groups/ combinations for which you want the load to be printed. Using the buttons ‘On/Off’ you can select all combinations or nothing at all.
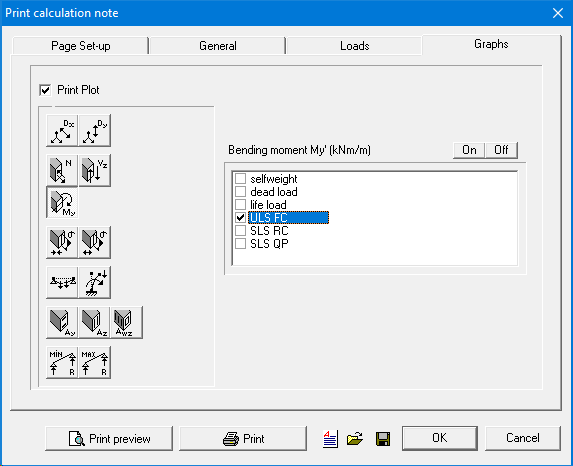
The tab page ‘Graphs’
- Select the option ‘Print Plot’ to indicate that you want the graphs to be printed.
- Then select a result by clicking on the relevant button on the left side.
- On the right side, you can indicate if you want to print the results for all the combinations or only for the selected combinations. Using the buttons ‘On/Off’ you can select all combinations or nothing at all.