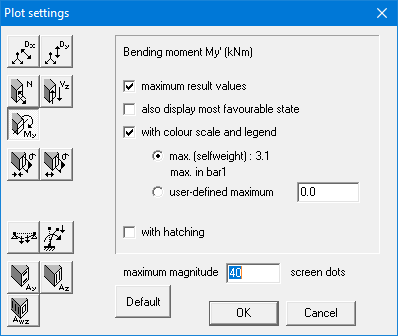
The way in which the results are presented can be set via the menu ‘Show – Plot settings…’ or by clicking the button ![]() in the toolbar.
in the toolbar.
On the left you will find the icons from the ‘Graphs’ section of the icon palette. You can set individual parameters for each icon:
- Click on the relevant icon.
- Then select the desired representation on the right. Everything you select is only valid for that specific result. However, the parameter for the maximum magnitude of the graph from the bar is valid for all results.
Alternatively, you can adjust the representation for all results in a single step.
- Click on the button ‘Default’.
- Select the desired representation on the right. Everything you select, will be applied to all results.
Let’s go over the various representations:
- When you select ‘maximum result values’, the minimum and maximum values are indicated on the graphs.
- In the case of an envelope, you can indicate whether you want to display the minimum graph in addition to the maximum graph with the parameter ‘also display the most favourable state.
- When you choose ‘with colour scale and legend’, the graphs are drawn in as a gradient, depending on either the occurring maximum value on the visible elements or a self-specified maximum value. Otherwise, the graphs are presented in the one colour.
- When you choose ‘with hatching’, a projection line between each point (total 11 points per bar), on the bar and the value will be drawn.
De wijze waarop de resultaten voorgesteld worden, kan u instellen via het menu ‘Toon – Gegevens plot…’ of door te klikken op de knop ![]() in de werkbalk.
in de werkbalk.

Aan de linkerkant vindt u de iconen uit het deel ‘Grafieken’ van het iconenpalet terug. Voor elk icoon kan u zelf afzonderlijke parameters instellen:
- Klik op het relevante icoon.
- Selecteer dan de gewenste voorstelling aan de rechter kant. Alles wat u rechts aanduidt, is enkel geldig voor dat ene resultaat. De parameter voor de maximale uitwijking van de grafiek t.o.v. de staaf is echter geldig voor alle resultaten.
U kan ook de voorstellingswijze voor alle resultaten aanpassen in één stap.
- Klik eerst op de knop ‘Default‘.
- Selecteer daarna de gewenste voorstelling aan de rechter kant. Alles wat u nu rechts aanduidt, is geldig voor alle
Overlopen we nu in bovenstaande dialoog de diverse voorstellingswijzen:
- wanneer u ‘resultaatwaarden maxima’ aankruist, worden de minimale en maximale waarden op de grafieken
- met de parameter ‘gunstigste toestand ook afbeelden’ geeft u aan of u, in het geval van een omhullende, naast de maximale grafiek ook de minimale grafiek wenst afgebeeld te
- wanneer u kiest voor ‘met inkleuring en schaal’, worden de grafieken in een kleurgradatie getekend, afhankelijk van hetzij de voorkomende maximale waarde op de zichtbare elementen, hetzij een zelf opgegeven maximale waarde. In het andere geval, worden de grafieken in eenzelfde kleur
- met de optie ‘met arcering’ wordt voor elk punt van de staaf waar de waarde getekend wordt (in totaal 11 punten per staaf), een projectielijn getekend van de grafiekwaarde naar het punt op de
Les paramètres d’affichage des résultats sont modifiables en utilisant l’icône ou via le menu ‘Montrer – Paramètres diagrammes…’.
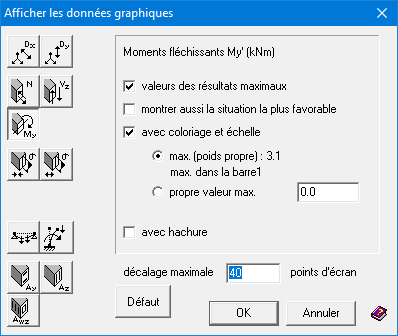
Le principe de cette fenêtre consiste à cliquer dans la partie gauche sur le bouton du résultat à paramétrer et à définir les paramètres associés dans la partie droite. 1•2•Build garde en mémoire les paramètres propre à chaque type de résultats.
On retrouve dans ces paramètres l’affichage ou non des valeurs maximales, l’affichage de la courbe minimale, le type de représentation (avec les bornes éventuelles pour l’échelle), l’hachure et la taille de la représentation.
Afin de permettre un paramétrage identique pour tous les types de résultats, il suffit de cliquer sur le bouton ‘Défaut’ et de donner les paramètres que vous voulez voir appliquer pour tous les résultats.