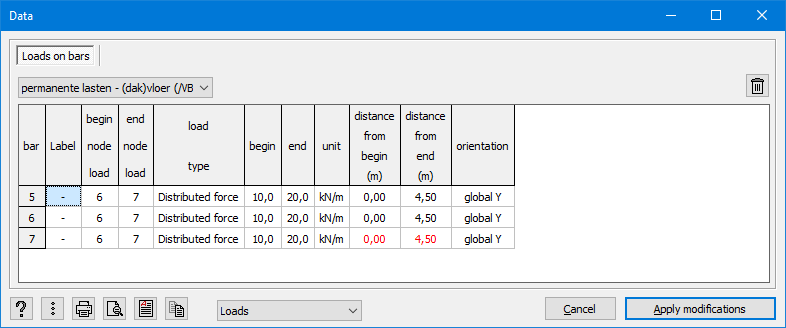
The red numbers appear because physical groups were used to defined the loads.
Cause
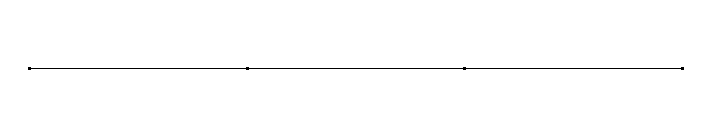
An example:
- A line of 9m is divided in 3 equal parts.
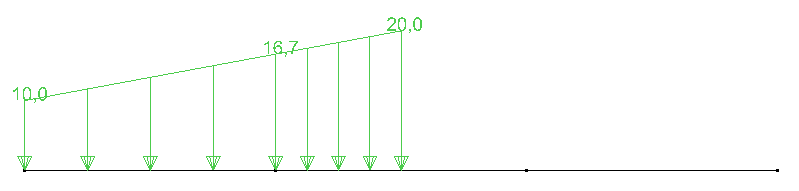
The loads on the bars should be these:
- To make the definition of the loads easier, the parts are physically grouped for loads (more info see this article).
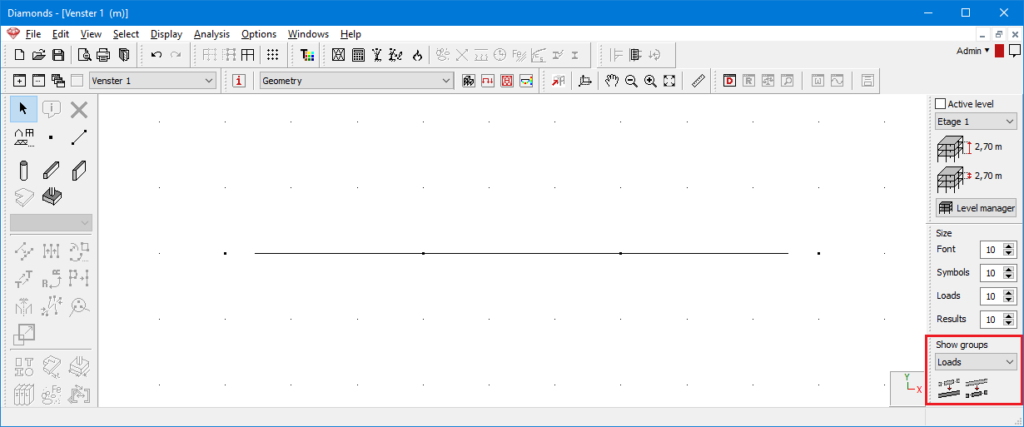
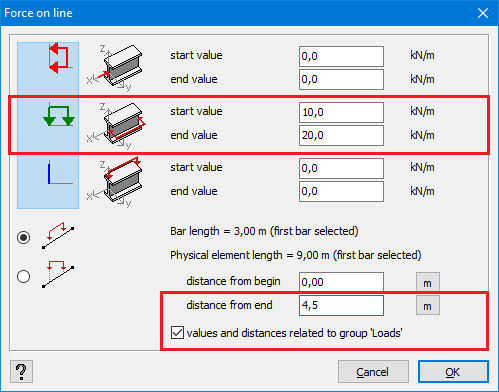
- Select the 3 lines and define a line load with the following settings:
- Set the start value to 10 and the end value to 20.
- Check the option “values and distances related to the group ‘Loads'”.
- Set the distance from end to 4,5m.
- Select the lines and open the data table
 . The load is defined on the entire physical group (which contains 3 bars). That’s why they’re 3 lines in the data table. Because the load is not physically on the last bar, the distances are written in red.