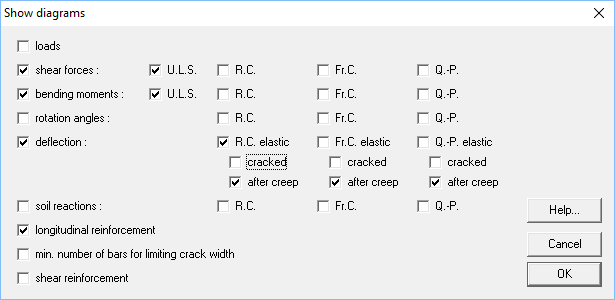
There a 4 types of lines on the deflection graph:
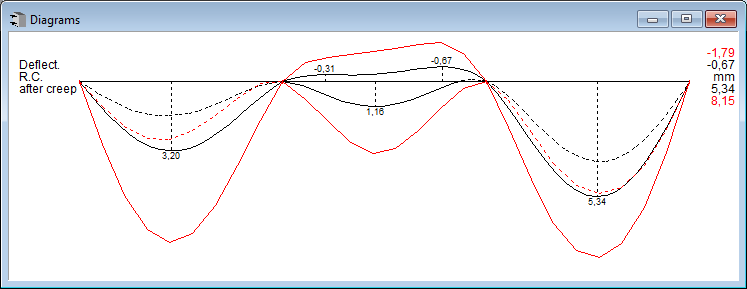
- The black lines are the elastic deflections:
- A black dashed line for the minimum deflection
- A black solid line for the maximum deflection
- The red lines are the cracked deflections:
- A red dashed line for the minimum deflection
- A red solid line for the maximum deflection
It is possible to see the elastic deflection plus creep effects (see below). However, this has no real meaning, because creep is a long term effect, and concrete will always be cracked at long term.